Power BI Portfolio: Boston Crime Analysis
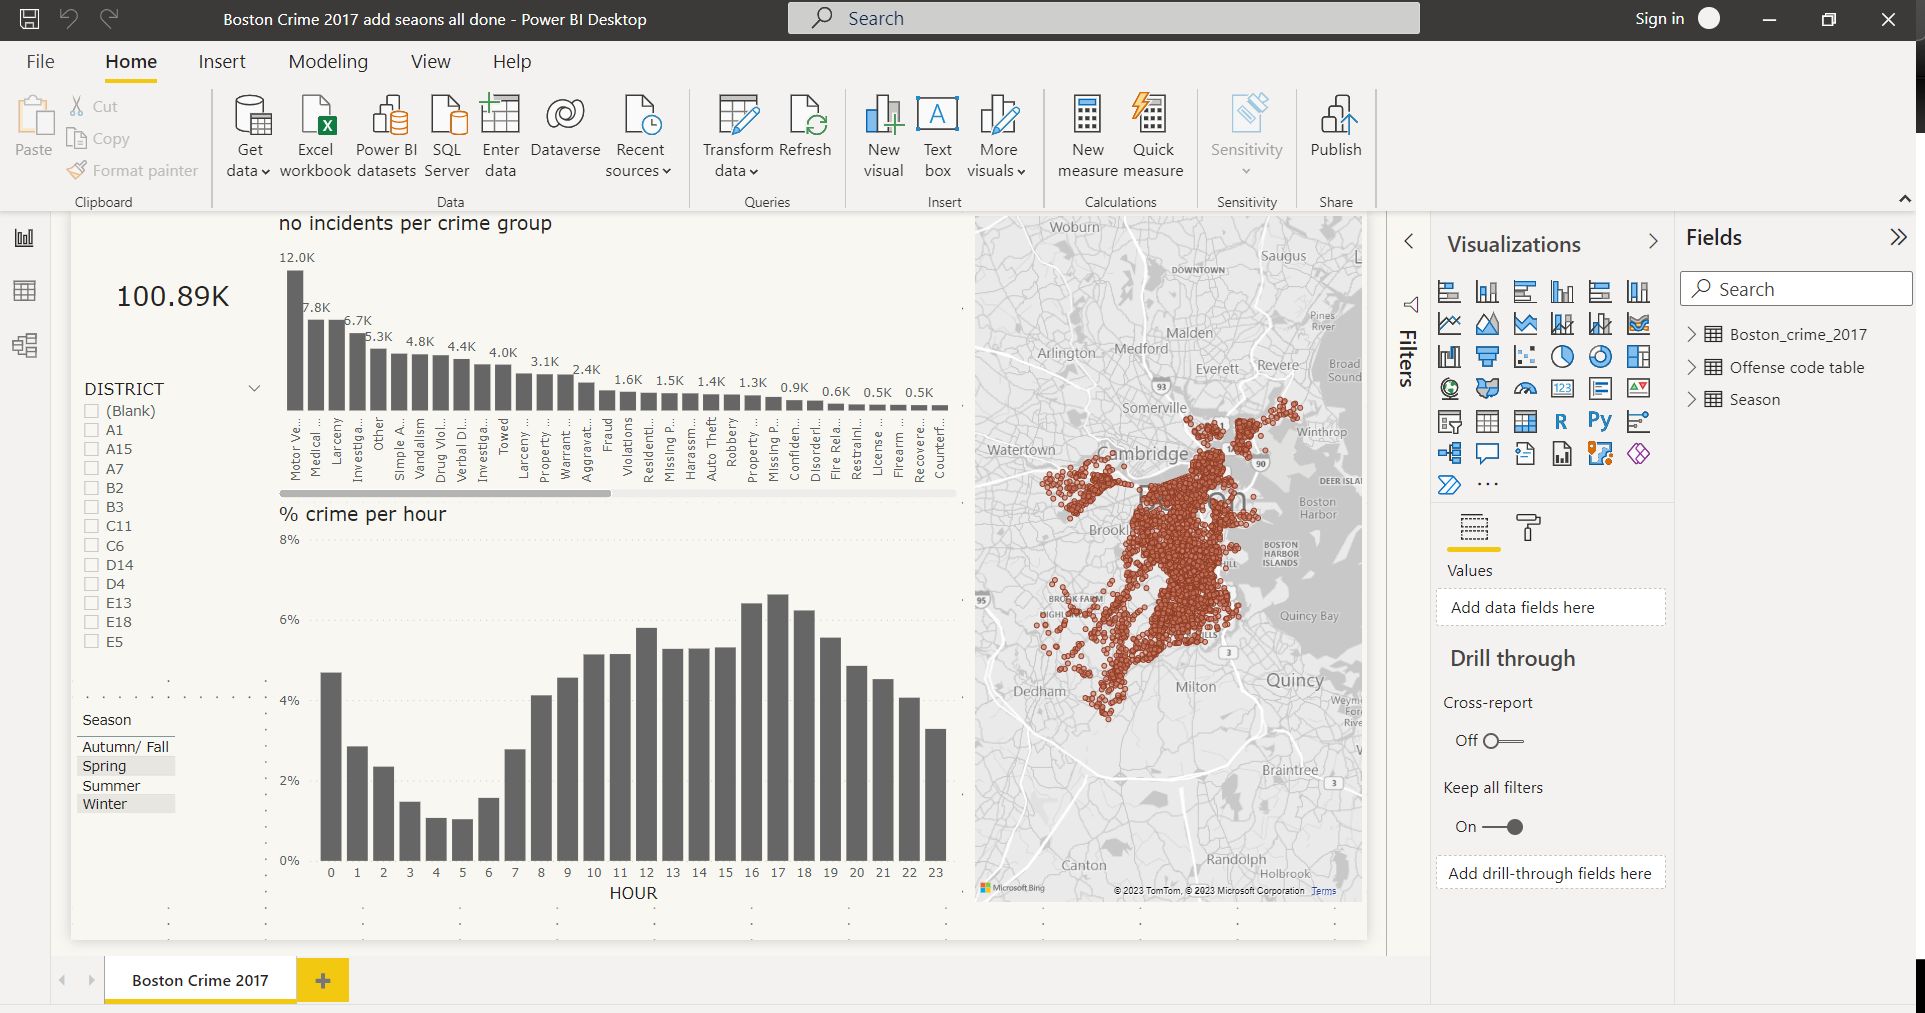
Welcome to my Power BI portfolio. This page showcases a data analysis project on Boston Crime in 2017. The project aims to visualize crime data in Boston, enabling users to derive insights and patterns regarding crime incidents.
Boston Crime 2017
This Power BI project utilizes various features such as maps, filters, and custom visuals. The project's primary goal is to enable stakeholders to make informed decisions based on data-driven insights.

Key Insights: [Mention a few insights or patterns found in the data visualization]
Check out the live demo or watch a video showcasing the project:
Return to the Main Page
