Welcome to My RStudio Portfolio
Scroll down to view the Palmer Penguins Project
Click the Titanic Project link to move on.
Data Exploration
Before diving into the analysis, I first explored the dataset to understand the various features and gather basic statistics.


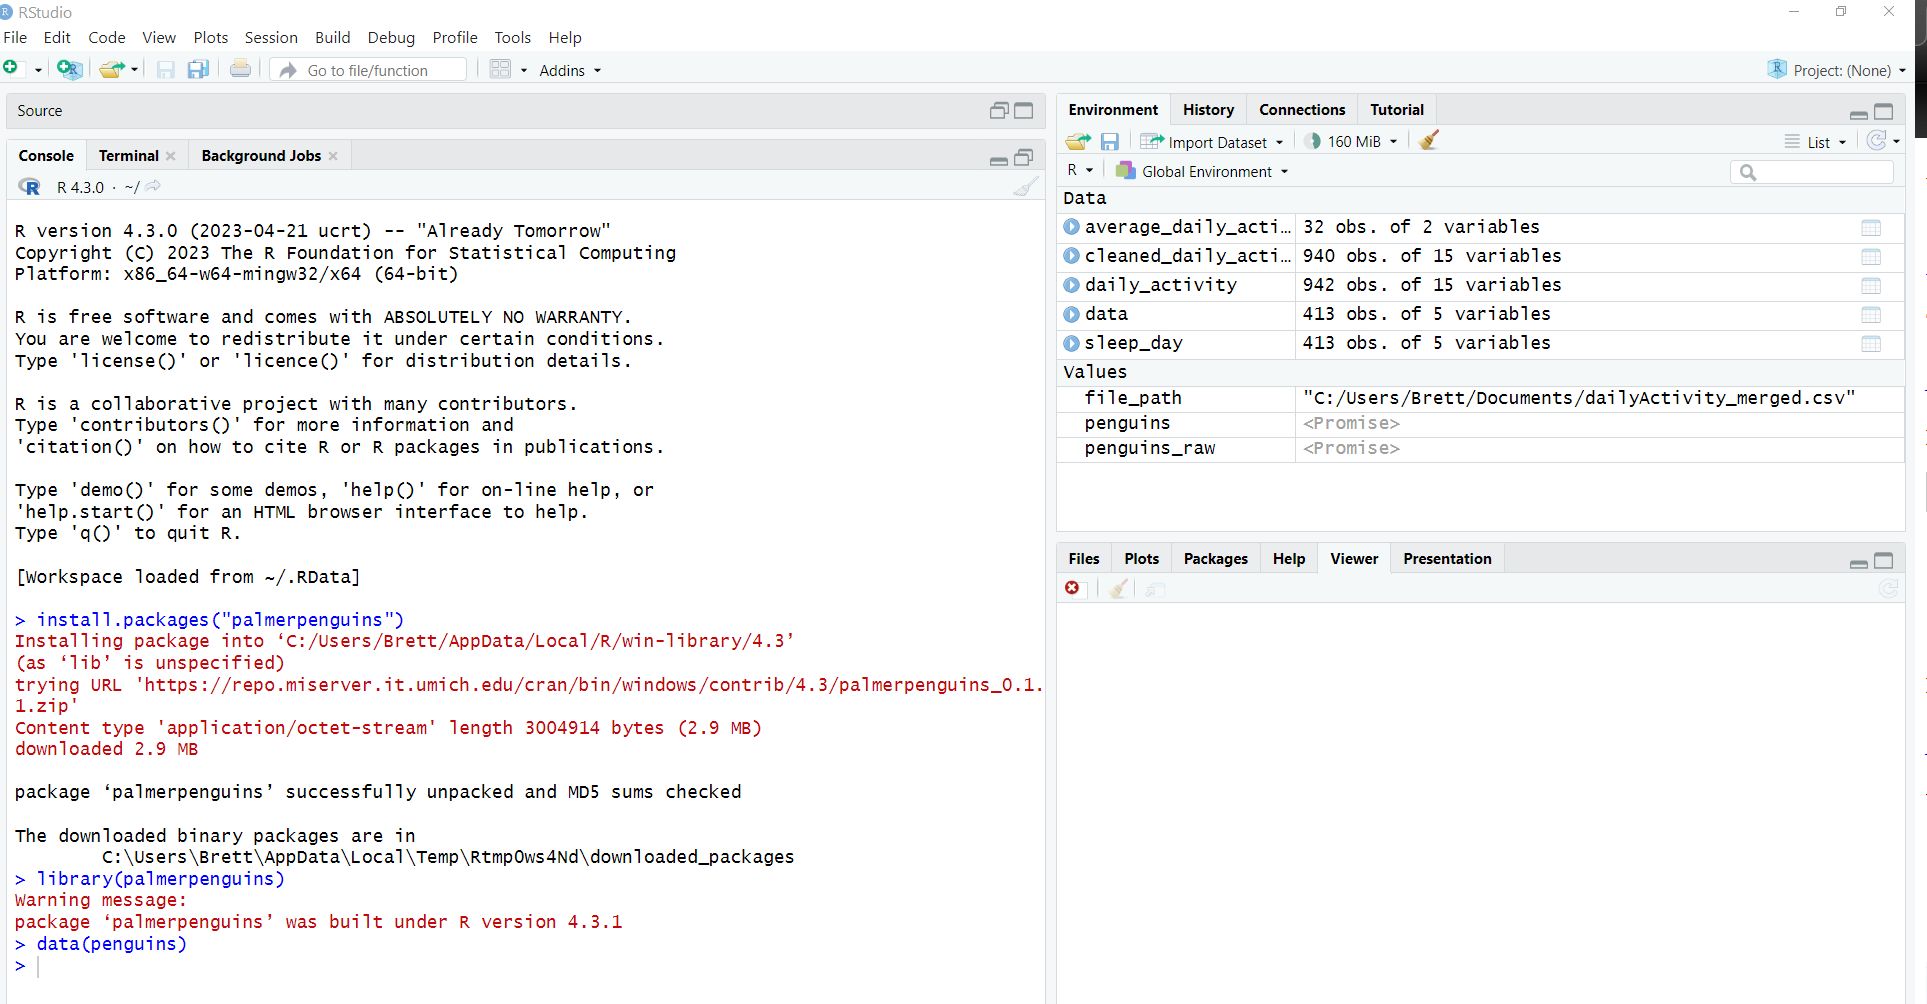
During data exploration, I found that the Palmer Penguins dataset contains the following variables:
| species |
island |
bill_length_mm |
bill_depth_mm |
flipper_length_mm |
body_mass_g |
sex |
year |
| Adelie |
Torgersen |
39.1 |
18.7 |
181 |
3750 |
male |
2007 |
The dataset contains a total of 344 observations and 8 variables.

Data Visualization
Visualizing data helps in better understanding and gaining insights. Here are two visualizations I created:


Statistical Analysis
I used R to perform statistical analysis on the Palmer Penguins dataset.
1. Calculate summary statistics for numerical variables:

2. Perform t-test comparing body mass between Adelie and Chinstrap penguins:

The Welch Two Sample t-test comparing body mass between Adelie and Chinstrap penguins resulted in a t-value of -0.54309, with a p-value of 0.5879. The test did not find a significant difference in the means of body mass between the two groups. The 95% confidence interval for the difference in means is -150.38481 to 85.53284.
3. Box Plots of Body Mass by Species:

The box plots illustrate the distribution of body mass among different species of penguins. The Adelie and Chinstrap penguins have similar body mass, while the Gentoo penguins have a significantly larger body mass compared to both Adelie and Chinstrap.
Conclusion and Insights
Based on the summary statistics for selected numerical variables:
- The bill length of the penguins ranges from 32.10mm to 59.60mm, with a median of 44.45mm and a mean of 43.92mm.
- The flipper length of the penguins ranges from 172.0mm to 231.0mm, with a median of 197.0mm and a mean of 200.9mm.
- The body mass of the penguins ranges from 2700g to 6300g, with a median of 4050g and a mean of 4202g.
These summary statistics provide insights into the distribution and central tendency of the measured variables in the Palmer Penguins dataset.
Video Demonstration
Watch this video for a proof of concept demonstration that will be replaced with a micro RStudio lesson.
 Return to the Main Page


